
Menu
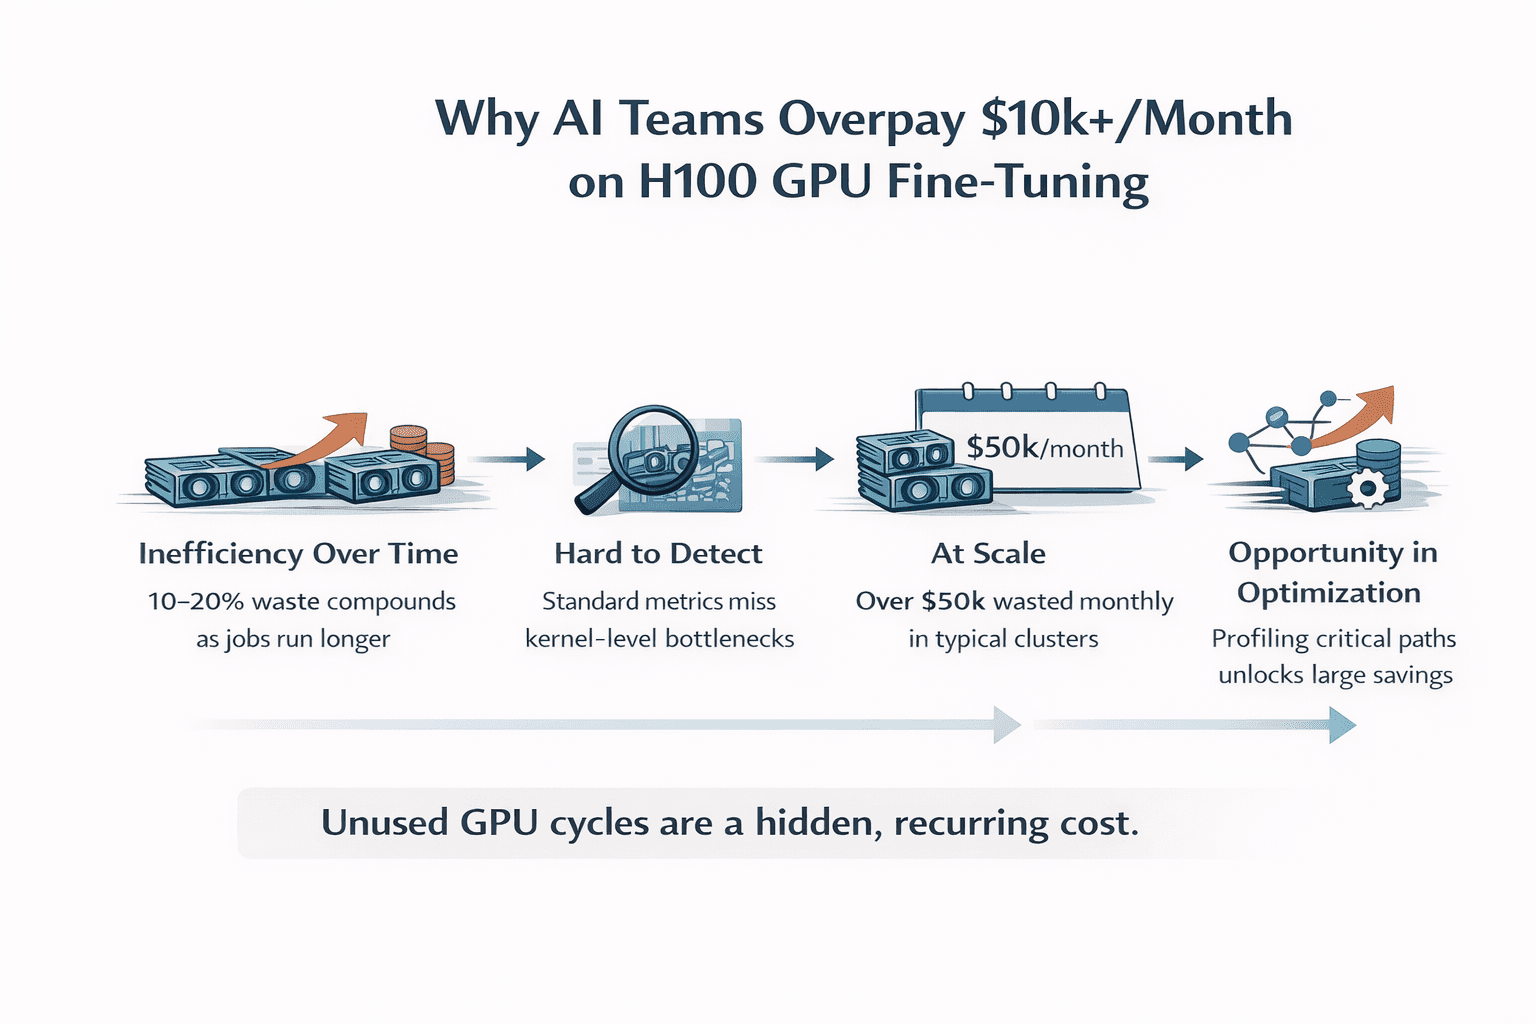
How Teams Are Quietly Overpaying ~$10,000+/Month on H100 Fine-Tuning
In AI training scenarios on GPU clouds, most teams assume that if their fine-tuning jobs complete successfully, their system is efficient. The model trains. Loss goes down. Results look correct. After that, everything must be fine.
But in practice, this assumption is often wrong. “Working” workloads are frequently overpaying workloads. Across multiple real-world fine-tuning setups, we consistently observe that 10–30% of GPU performance is left unused.
Not because the model is poorly designed. Not because the hardware is insufficient. But because of execution inefficiencies buried inside the workload itself.
At a lower level, modern training pipelines are composed of hundreds of kernel executions—many of which are not compute-bound, but memory-bound. Operators such as normalization layers (e.g., RMSNorm), activation functions (e.g., SiLU), and tensor reshaping paths often:
Underutilize available SM compute capacity
Stall on memory bandwidth or cache misses
Introduce synchronization and scheduling overhead between kernels
These inefficiencies don’t show up in high-level metrics like loss or accuracy. Instead, they manifest as:
Lower achieved occupancy relative to theoretical peak
Suboptimal memory throughput compared to hardware limits
Increased latency across the forward and backward passes
Because each individual operator may only contribute a small delay, the impact is easy to overlook. But across an entire training step, these effects accumulate, quietly limiting end-to-end throughput. The result is a system that appears to be functioning correctly, but is systematically underutilizing the GPU.
Since GPU cost is directly tied to time-to-completion, any unused performance is effectively paid for but never realized. The dangerous part is that this compounds over time. At a small scale, this inefficiency is easy to dismiss. A slightly longer run here, a bit more GPU time there; it doesn’t raise concern. But at production scale, this becomes a recurring cost. Every training job runs longer than necessary, every experiment consumes more GPU hours than required, and every month unnecessary spend accumulates. What appears to be a minor inefficiency gradually becomes a continuous, hidden tax dollars on your infrastructure.
Why it rarely gets fixed
Because the system never fails, there is no forcing function to act. There are no alerts, no degradation in accuracy, and no obvious breaking point. The workload completes, results look correct, and everything appears stable. As a result, the inefficiency is rarely investigated. It persists quietly in the background, scaling alongside usage. The system works, so the problem is ignored. The challenge is that this class of inefficiency is rarely visible. Standard metrics like loss and accuracy validate correctness, not efficiency, so nothing appears broken. Profiling, when it’s done, is often too coarse to surface operator-level bottlenecks, and detailed traces are complex enough that they’re rarely analyzed continuously.
As a result, most workloads are treated as “good enough,” even when a meaningful portion of GPU cycles are being underutilized. Because there’s no failure signal, i.e. no crash, no degradation in results, there’s little incentive to investigate further. The inefficiency becomes part of the baseline.
Over time, this turns into a structural financial cost. Each run takes slightly longer than necessary, each experiment consumes more GPU hours than required, and the excess spend accumulates month after month. At production scale, this is no longer a one-off inefficiency; it becomes overpaid dollars that are never brought out to the surface.
The shift happening now
A shift is beginning to emerge among leading teams. The next layer of optimization is no longer model design, but execution efficiency. It is not about building larger models or adopting new training strategies, but about ensuring that existing workloads fully utilize the hardware they already run on. The focus is moving from “what the model does” to “how efficiently it runs.”
The real question
If your workloads are “working,” the question is no longer whether performance can be improved. The more important question is:
How much are we currently overpaying without realizing it?
What does 10–15% inefficiency actually cost?
To understand the impact, consider a typical fine-tuning setup on H100 GPUs. Take a relatively small cluster: 8 H100 GPUs running continuously, with a conservative blended cost of around $2.50 per GPU per hour. This translates to roughly $20 per hour for the cluster, or approximately $14,400 per month when running 24/7.
Now introduce a 10–15% inefficiency in execution.
At 10%, this results in about $1,440 in wasted GPU spend per month. At 15%, that number increases to roughly $2,160 per month. For smaller teams, this may seem manageable—but it represents cost that delivers no additional performance or output.
At a more realistic production scale, the numbers change quickly.
Consider a 32-GPU H100 cluster under the same assumptions. Monthly GPU cost rises to approximately $57,600. At this level:
10% inefficiency → ~$5,760/month
15% inefficiency → ~$8,640/month
20% inefficiency → ~$11,520/month
This is where the “$10k+/month” figure becomes tangible.
And importantly, this is not an edge case. For teams operating production-scale workloads, these inefficiencies are common and often go unmeasured.
These operators:
Don’t fully utilize compute
Create memory bandwidth pressure
Quietly slow down the entire forward pass
Because they are small individually, they’re often ignored. But together, they limit end-to-end throughput.
What we observed in practice
On Qwen3 fine-tuning workloads running on H100, a consistent pattern emerged: a small number of memory-bound operators were responsible for a disproportionate share of runtime inefficiency. Individually, these operators appeared insignificant, but together they formed part of the critical execution path—capping throughput and extending total runtime.
By focusing on this subset and optimizing them at the kernel level, we were able to directly reduce that inefficiency. Forward-pass latency dropped by roughly 50%, and end-to-end throughput improved by about 11%. These improvements were achieved without modifying the model architecture, training pipeline, or hardware configuration—the only change was in how the workload executed.
What matters is what this translates to in cost. For a typical production setup, e.g. a 32× H100 cluster running continuously at roughly $57,600 per month, an 11% improvement in throughput means the same workload completes using ~11% less GPU time.
~$6,300 less in GPU cost per month for the same output.
Forward-pass impact (where the inefficiency concentrates)
In many fine-tuning workloads, a significant portion of runtime is concentrated in the forward pass, especially around memory-bound operators like normalization and activation layers. By reducing forward-pass latency by ~50%, we effectively compress one of the dominant components of each training step. To make this concrete, assume the forward pass accounts for ~40–50% of total step time (a common range in practice). A 50% reduction in that portion translates to roughly a 20–25% reduction in total step time for that segment alone.
On the same 32× H100 cluster (~$57,600/month), that corresponds to ~$11,000–$14,000/month in potential cost reduction tied to forward-pass optimization. The exact number depends on workload characteristics, but the pattern is consistent. The inefficiency is concentrated—and so are the gains. Nothing about the model changes. The results are identical. The only difference is that you are no longer paying for wasted execution time.
At larger scales, the impact increases proportionally. A 64-GPU cluster would see savings in the range of ~$12k/month (throughput) and potentially more where forward-pass inefficiencies dominate. This is not a performance benchmark; it is a direct reduction in infrastructure spend.
Conclusion
At a glance, most AI workloads appear to be functioning as expected. Models train, metrics improve, and pipelines run end-to-end. But as we’ve seen, “working” does not mean efficient, and at scale, that gap translates directly into real, recurring cost. What makes this challenging is not the existence of inefficiency, but its invisibility. It doesn’t break systems or degrade accuracy. It simply extends runtime, increases GPU usage, and quietly compounds into thousands of dollars in unnecessary spend each month.
The opportunity, however, is equally clear. By focusing on execution efficiency, specifically at the operator and kernel level, it is possible to recover that lost performance without changing the model, the training pipeline, or the underlying hardware. The result is straightforward: the same workloads complete faster, consume fewer GPU hours, and cost less to run. This is not about incremental optimization; it’s about eliminating waste that already exists in production systems. For teams operating at scale, the question is no longer whether inefficiency exists, but how much it is costing, and how quickly it can be reduced.
At Neural Nova AI, this is exactly where we focus. We work directly on real workloads, identify where performance is being left on the table, and turn that into measurable improvements in both throughput and cost. If your workloads are already running, the opportunity is already there. The only question is whether it’s being captured.
A note on engagement
We’re currently working with a small number of teams to evaluate their production workloads, profiling execution at the operator level, identifying where performance is being left on the table, and quantifying what that translates to in real GPU cost. For teams running fine-tuning at scale, this often surfaces inefficiencies that aren’t visible through standard metrics but have a direct impact on time-to-completion and monthly spend. Because this process requires deep integration and careful validation on real workloads, we’re limiting the number of engagements in this phase to ensure each team gets meaningful, actionable results.