
Beyond CUDA: Extending Neural Nova's Optimization of GLM 5.2 to AMD MI325X

Beyond CUDA: Extending Neural Nova's LLM Optimization to AMD MI325X
Serving GLM-5.2 on eight AMD MI325X GPUs, Neural Nova's optimized vLLM configurations raised output throughput by 26.8% (bf16) and 17.9% (FP8) at maximum concurrency, while cutting total benchmark duration by as much as 21.1%.
Under a fully saturated workload — unlimited request arrival, where time to first token is dominated by queue depth rather than compute — the same configurations reduced median TTFT by 77.9% and average queue depth by 43.6%, largely by admitting and clearing requests more efficiently.
These are throughput- and queue-oriented gains. Both configurations also regressed on p99 token-generation latency. That trade-off is not a footnote; it is the point of this post. Serving optimization is a multi-objective problem, not a single number, and the right configuration depends on what the deployment is actually optimizing for.
Why this experiment
AI inference optimization is often treated as a hardware-specific exercise. A configuration that performs well on one GPU architecture can behave very differently on another, because the serving runtime, kernel implementations, memory hierarchy, communication stack, and scheduler all interact with the workload.
For any operator running heterogeneous GPU infrastructure, that is an operational problem. Supporting both NVIDIA and AMD hardware should not require maintaining two separate performance-engineering processes.
Neural Nova is built around a different approach: keep the optimization workflow consistent, and adapt the resulting configuration to the target hardware, model, serving framework, and workload. Most of our published work so far has targeted NVIDIA GPUs. Here we extended the same vLLM optimization workflow to AMD's ROCm ecosystem and benchmarked two GLM-5.2 variants — bf16 and FP8 — on eight AMD MI325X GPUs.
How the configurations were selected
We did not hand-pick these flags. Each configuration was produced by the Nova AI Engine, which searches the serving-configuration space — distributed executor, KV-cache dtype, maximum sequences and batched tokens, prefix caching, scheduling, and compilation/graph-capture settings — and evaluates candidate configurations per model at each concurrency level, ranked by output throughput under the measured workload.
The same engine runs against both NVIDIA/CUDA and AMD/ROCm targets. Extending to MI325X meant changing the target and enabling the ROCm AITER runtime path — not rebuilding the workflow. That portability is the actual result of this experiment; the throughput numbers are how we measured it.
Experimental setup
We used vllm bench serve to measure online serving performance. Each benchmark ran 1,000 measured prompts plus 10 warmup requests excluded from the results, across maximum concurrency levels of 32, 64, 128, 256, and 512 with an unlimited request arrival rate.
The benchmark used a synthetic random dataset with variable sequence lengths sampled uniformly around the nominal input and output lengths.
Parameter | Value |
|---|---|
Measured prompts | 1,000 |
Excluded warmups | 10 |
Maximum concurrency | 32, 64, 128, 256, 512 |
Request rate | Unlimited |
Input length | 409–3,686 tokens (nominal 2,048) |
Output length | 51–460 tokens (nominal 256) |
Range ratio | 0.8 |
Hardware | 8× AMD MI325X |
We evaluated zai-org/GLM-5.2 (bf16) and zai-org/GLM-5.2-FP8, both served with tensor parallelism across all eight GPUs.
The baseline
The baseline was intentionally simple: enable vLLM's ROCm AITER path, tensor parallel size eight, 95% of GPU memory allocated to the runtime, and a maximum model length of 65,536 tokens.
The same baseline structure was used for the bf16 model. This gave us a consistent starting point from which to evaluate the effect of runtime, scheduler, memory, batching, and compilation settings.
What the optimizer changed
The optimized configurations changed several interacting parts of the serving stack rather than relying on one isolated flag. The search covered the distributed execution backend, GPU memory allocation, FP8 KV-cache, maximum active sequences, maximum batched tokens, prefix caching, asynchronous scheduling, long-prefill scheduling, multiprocessing behavior, and compilation/graph-capture settings.
GLM-5.2-FP8, concurrency 512:
GLM-5.2 (bf16), concurrency 512:
These settings do not operate independently. Reducing KV-cache memory per token (via FP8 KV-cache) frees room for more concurrent sequences, but raising sequence concurrency changes queueing behavior and inter-token latency. The best configuration therefore depends on which metrics the deployment cares about — which is exactly why an objective-aware search matters more than a fixed recommended flag set. We validated on GSM8K (1,000 samples) and observed less than 1% accuracy degradation.
GLM-5.2-FP8 results (concurrency 512)
Metric | Baseline | Optimized | Change |
|---|---|---|---|
Output throughput | 1,052.4 tok/s | 1,240.6 tok/s | +17.9% |
Duration | 246.7 s | 209.3 s | −15.2% |
Mean TTFT | 25,598 ms | 22,212 ms | −13.2% |
Median TTFT | 6,850 ms | 2,670 ms | −61.0% |
p99 TTFT | 93,740 ms | 82,540 ms | −11.9% |
Mean TPOT | 392.8 ms | 335.0 ms | −14.7% |
p99 TPOT | 698.4 ms | 941.0 ms | +34.7% |
Mean ITL | 364.0 ms | 305.1 ms | −16.2% |
p99 ITL | 883.0 ms | 1,249.3 ms | +41.5% |
Median E2E latency | 110,848 ms | 94,058 ms | −15.1% |
KV-cache peak | 68.6% | 35.7% | −48.0% |
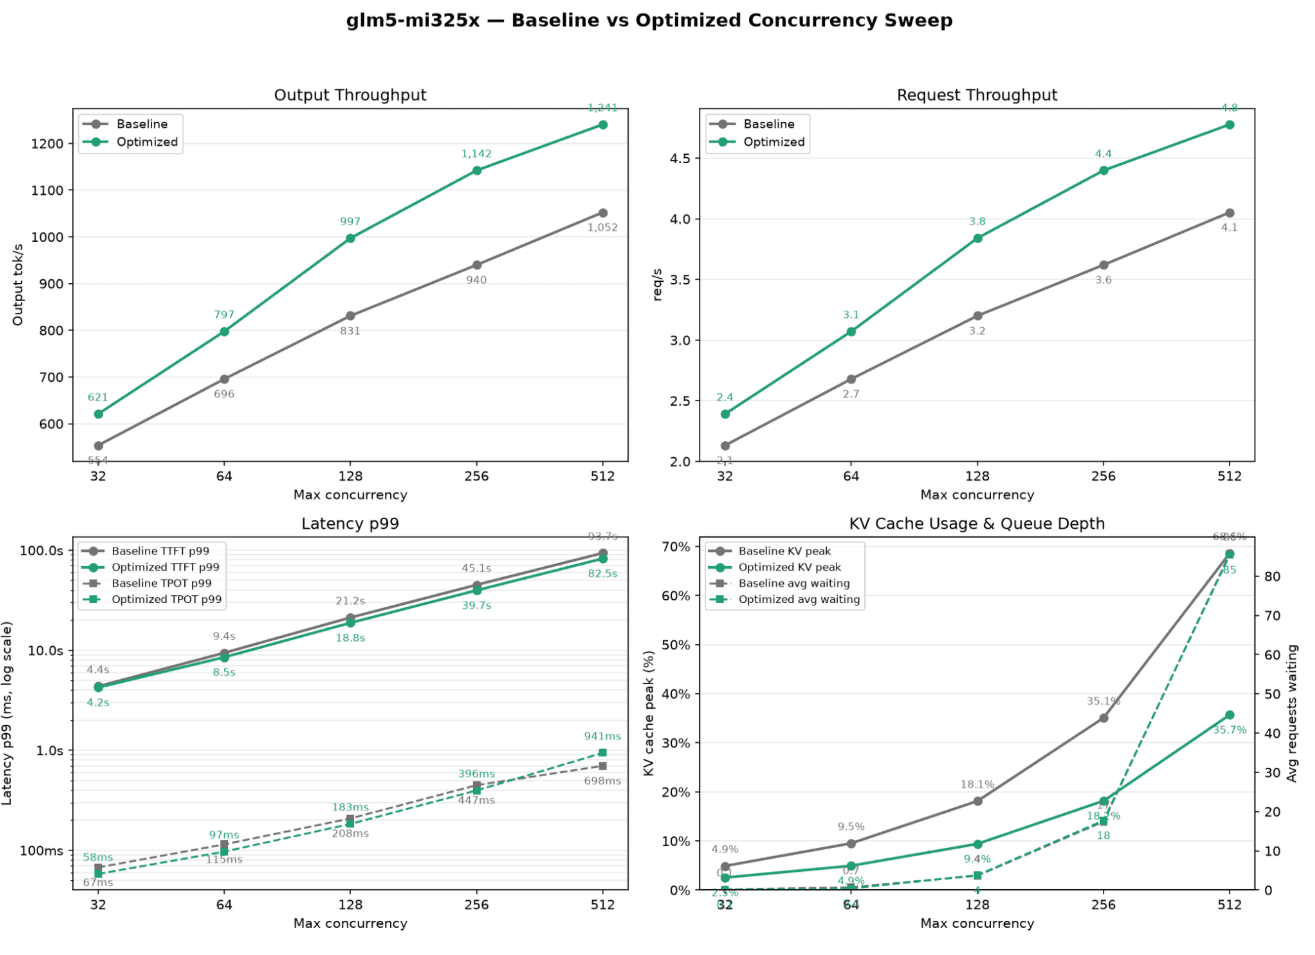
Figure 1 — GLM-5.2-FP8, baseline vs optimized across the full concurrency sweep. The optimized configuration (green) leads on output and request throughput at every concurrency level; its p99 token-latency curves rise above the baseline at high load, and peak KV-cache usage stays well below it.
Throughput rose 17.9% and the benchmark finished 15.2% faster. Time to first token improved across mean, median, and p99, with the largest change at the median (6.85 s → 2.67 s). Mean per-token and inter-token latency both improved, and peak KV-cache utilization dropped nearly in half, from 68.6% to 35.7%.
The regression is in the tail: p99 TPOT rose from 698 ms to 941 ms and p99 ITL from 883 ms to 1,249 ms. The optimized server processed the overall workload faster and improved average token-generation latency, but the slowest requests saw less consistent token delivery.
GLM-5.2 (bf16) results (concurrency 512)
The improvement was larger for the bf16 model.
Metric | Baseline | Optimized | Change |
|---|---|---|---|
Output throughput | 1,019.0 tok/s | 1,292.2 tok/s | +26.8% |
Duration | 254.8 s | 200.9 s | −21.1% |
Mean TTFT | 49,744 ms | 23,774 ms | −52.2% |
Median TTFT | 51,841 ms | 11,448 ms | −77.9% |
p99 TTFT | 104,700 ms | 77,224 ms | −26.2% |
Mean TPOT | 269.7 ms | 294.2 ms | +9.1% |
p99 TPOT | 524.6 ms | 744.4 ms | +41.9% |
Mean ITL | 258.1 ms | 272.2 ms | +5.5% |
p99 ITL | 783.9 ms | 1,079.5 ms | +37.7% |
Median E2E latency | 110,457 ms | 85,579 ms | −22.5% |
Avg. waiting requests | 169.5 | 95.7 | −43.6% |
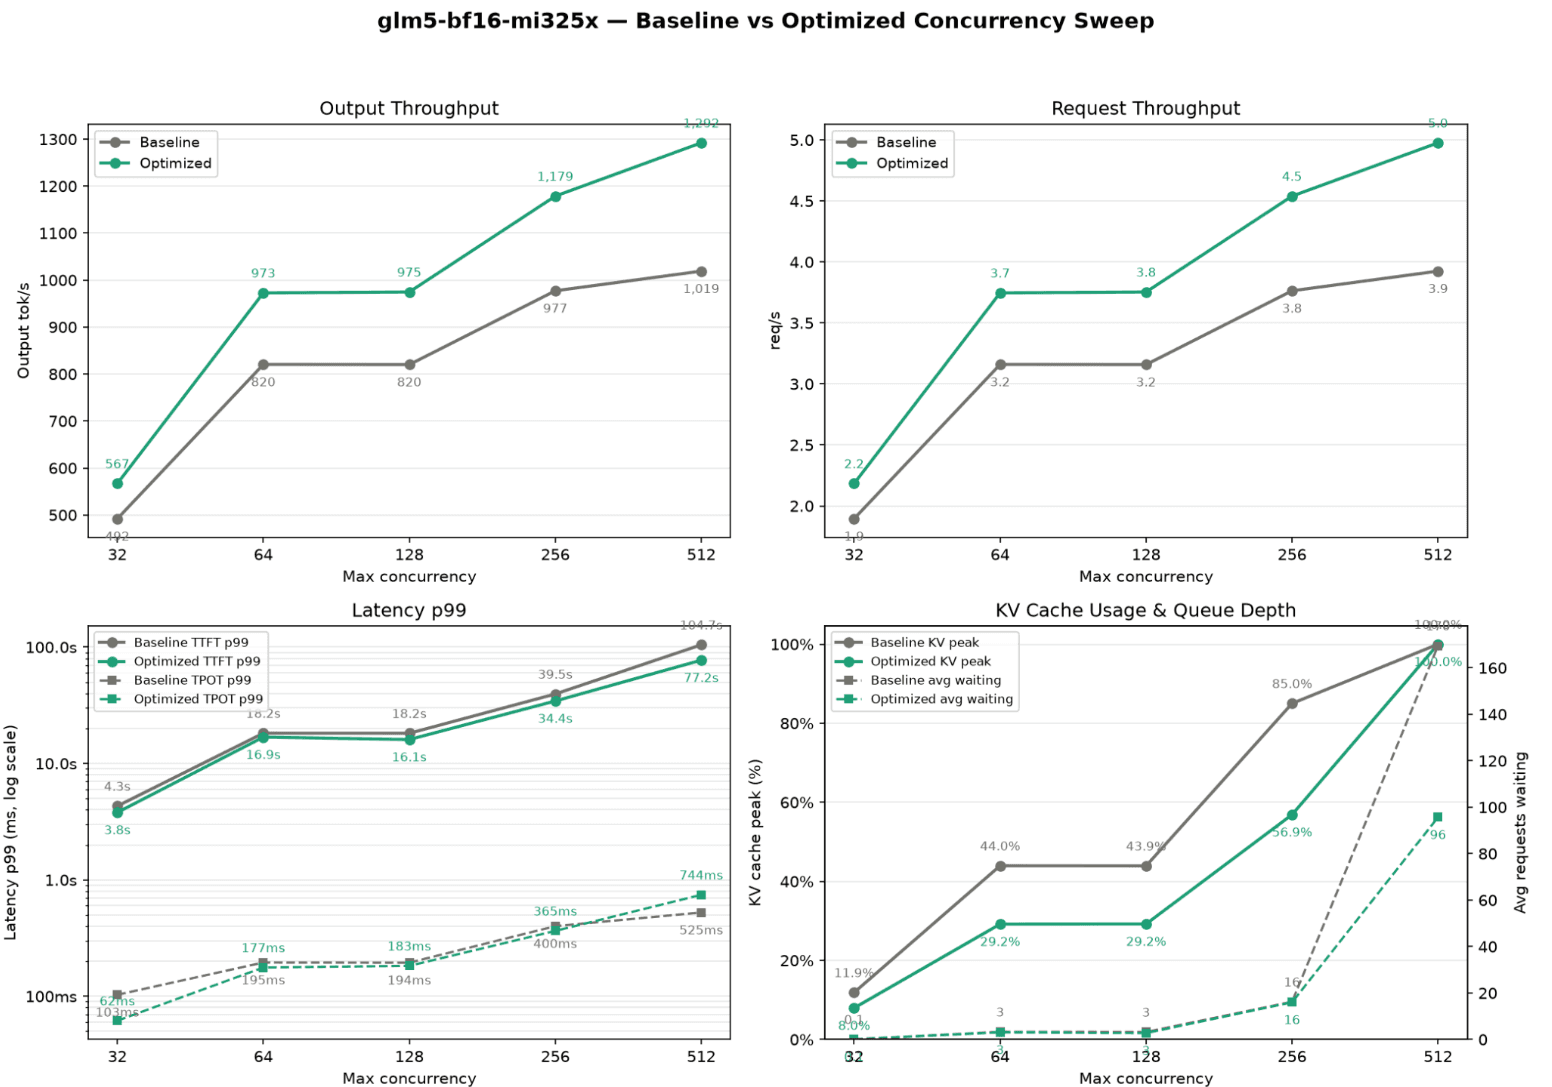
Figure 2 — GLM-5.2 (bf16), baseline vs optimized across the full concurrency sweep. The throughput gap widens as concurrency rises, average waiting requests fall sharply under saturation, and — as with FP8 — the optimized p99 token-latency curves sit above the baseline at high load.
Throughput rose 26.8% and duration fell 21.1%. The headline number is median TTFT, down 77.9% (51.8 s → 11.4 s), with mean TTFT down 52.2%.
That figure needs its context. With an unlimited arrival rate, the server is a firehose: a baseline median TTFT of 51.8 seconds is a backpressure artifact, not an interactive-latency measurement. The right way to read it is that the optimized configuration cut average queue depth by 43.6% (169.5 → 95.7 waiting requests) and admitted and cleared work far more effectively under saturation. This is a high-throughput, queue-reducing configuration — not one that minimizes interactive latency.
As with FP8, the tail moved the other way: p99 TPOT rose 41.9% and p99 ITL 37.7%, and even mean TPOT/ITL rose slightly. KV-cache utilization was pinned at 100% in both runs.
How the gains scale with concurrency
The tables above report the saturated endpoint at concurrency 512; the throughput and queue-depth panels in Figures 1 and 2 show the full picture. Across the sweep (32 → 512), the optimized configuration led the baseline on output and request throughput at every tested concurrency level for both models, with the gap widening as concurrency increased — consistent with a configuration tuned to keep the GPUs fed under load. The p99 latency panels show the flip side: the token-latency trade-off is a high-load phenomenon, and at low concurrency the two configurations track closely.
What this means for cost
At fixed hardware, cost per token is inversely proportional to output throughput, so these throughput gains translate directly into a lower cost per million tokens. Take an eight-GPU MI325X node at an on-demand rate of $2.00/GPU-hour — $16.00/hour for the node — which sits near the low end of current market pricing:
Model | Config | Throughput | Cost / 1M tokens |
|---|---|---|---|
GLM-5.2 (bf16) | Baseline | 1,019.0 tok/s | $4.36 |
GLM-5.2 (bf16) | Optimized | 1,292.2 tok/s | $3.44 |
GLM-5.2-FP8 | Baseline | 1,052.4 tok/s | $4.22 |
GLM-5.2-FP8 | Optimized | 1,240.6 tok/s | $3.58 |
For the bf16 model, that is $0.92 less per million output tokens — about $920 per billion tokens served, or a 21% reduction — from a configuration change alone, on the same hardware. FP8 saves $0.64 per million (15%). The percentage is rate-independent: it holds whether you pay $2/GPU-hour on-demand or a lower reserved rate, and the shorter total job duration compounds the saving on batch workloads. For an infrastructure operator, that is often the number that matters most.
Why one "best configuration" does not exist
Inference benchmarks are frequently reduced to a single throughput figure. Production systems are not that simple. A configuration can improve aggregate throughput, request throughput, time to first token, queue depth, memory efficiency, and completion time while simultaneously worsening p99 inter-token latency, p99 time per output token, and token-delivery consistency for the slowest requests. That is not a failed optimization — it is evidence that serving optimization is genuinely multi-objective.
Different deployments sit at different points:
A batch-processing service prioritizes maximum tokens per second and minimum total job duration.
A conversational application prioritizes median TTFT and smooth token streaming.
A latency-sensitive agent places hard limits on p99 TTFT and p99 ITL.
An infrastructure provider optimizes primarily for cost per million tokens.
These objectives can lead to different configurations on identical hardware — which is why our direction is not to publish one static set of recommended flags, but to evaluate configurations against the customer's actual workload and select the appropriate trade-off for that deployment.
The same coupling extends to hardware. This experiment shows the workflow operating against AMD ROCm, not just CUDA — it does not mean a single inference job runs jointly across both, but that the workflow can target more than one GPU ecosystem. As fleets diversify, operators face two coupled questions: which hardware should run a given workload, and which serving configuration performs best on it. A model may hit peak raw throughput on one GPU type but a better cost-per-token ratio on another; one configuration suits interactive traffic, another suits offline generation. Supporting optimization across both NVIDIA and AMD lets us treat hardware selection and runtime tuning as one combined problem.
Conclusion
Both configurations traded p99 token-generation latency for throughput and queue-clearing gains — which is precisely why production optimization cannot rely on throughput alone. The correct configuration depends on the objective.
This MI325X experiment is an early step toward a hardware-portable optimization layer: one workflow that evaluates models and workloads across GPU platforms and selects configurations against the performance, latency, memory, and cost requirements of the deployment.